


Relocation Campaigns
Overview
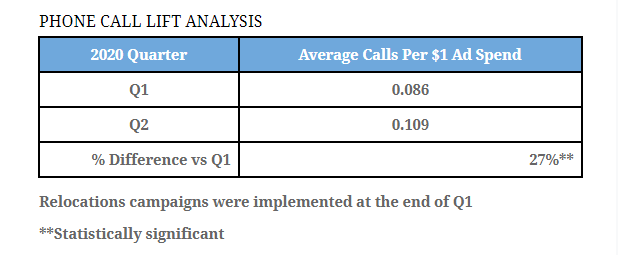
Oftentimes properties gain renter interest from out-of-state searchers. As property managers start to understand exact locations in where their residents are moving from, Digible can utilize this information and launch relocation campaigns.
Relocation campaigns include keywords such as “apartments Denver CO”, but target a common location where people are moving from rather than a radius around the property. These campaigns are set up to run alongside our standard search account campaigns in an effort to more efficiently target and allocate budget for users in specific areas (designated by our property managers) who are searching for apartments in our client’s location.
Conclusion
When looking at the average number of phone calls per $1 ad spend, we saw lifts of statistical significance both immediately after implementation and in the months since, as compared to the three months prior to implementation.
Implementing relocation campaigns can be an excellent way to drive mid-funnel users to site and promote conversion rates in-line with top performing, non-brand campaigns, as well as ensure lower CPL’s.
Neighborhood Keywords
Overview
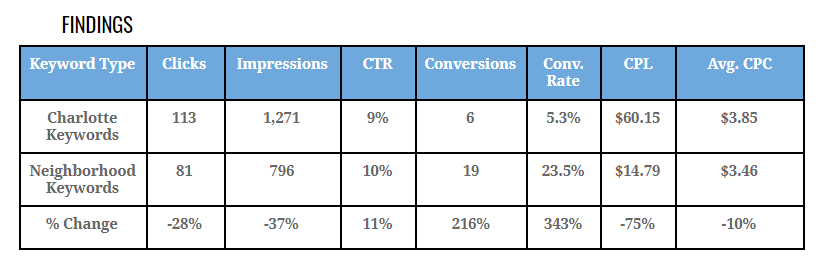
The Charlotte market is highly saturated and we can find ourselves inflating CPCs across different accounts within this market. On October 27th, we launched neighborhood specific keywords to run alongside Charlotte keywords in an effort to help curb rising CPCs and enable us to reach highly qualified buyers. We selected one neighborhood to test (i.e. Mallard Creek), but you could test a variety of neighborhoods and/or work with your client to find what is best for you.
Conclusion
Implementing neighborhood specific keywords can be an excellent way to drive more efficiency in accounts and get qualified buyers to your client’s website.
Remarketing Lists for Search
Overview:
Trying to drive quality leads and improve efficiency within your Paid Search account can be a daunting task. With limited ad dollars, you want to ensure that you are getting in front of the most highly qualified audience. But how do you do this? Enter Remarketing List for Search Ads (RLSAs). This audience list allows you to create campaigns that exclusively target users who have previously visited your website.
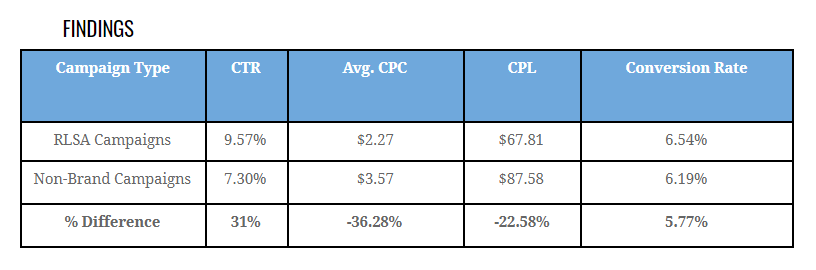
There are many benefits of running RLSA campaigns. You can tailor your ad copy towards returning visitors and increase bids to show in a stronger position on the SERP, while simultaneously driving a better conversion rate at a lower CPL.
Conclusion:
Creating an RLSA campaign can be a great lower-funnel initiative to improve efficiency in your account and drive qualified leads to the client’s website. However, if your client is looking to grow quickly, then this might be a tactic to implement down the road, since the size of these audience lists is limited*
*audience size must contains at least 1,000
Dynamic Search Campaigns
Overview:
This test measures the performance of Google’s Dynamic Search Ad campaigns in direct comparison to Digible’s current mix of both Campaign and Ad Types. Dynamic Search Ads generate their pool of keywords from a designated list of landing pages from the client’s website. Matching the keywords scraped from the client landing pages it then matches these keywords to user search terms and generates headlines that most accurately match the user’s search query to keywords on the landing page.
Conclusion:
Produced Relevant Ads – *tested on one property over 30 days
11.80% CTR & 22.89% Conversion Rate
Aggressive CPC
-
Dynamic Ad Target is specific to these campaigns and the Max CPC overrode our Ad Group Max CPC of $2.50
-
Average CPC of $6.48
164% higher CPC compared to account average of $2.45
To conclude, Dynamic search campaigns can be a quick and effective way to generate more traffic to your website and highlight the specific features that make your apartment stand out. The ability to create headlines from a user’s search term significantly increases the user’s likelihood of interacting with your ad. Clients that have invested time in SEO and have quality websites will be great matches to utilize this campaign type.
Impression Share Analysis
Overview:
This test measures the performance of properties that significantly increased their budgets in August based on recommendations from Digible’s impression share document. The impression share doc focuses on impression share by campaign, calculates lost impression share, and then recommends an increase in spend in order to increase search presence. The purpose of this case study is to understand how increasing budget changes performance for overall accounts and by campaigns.
Findings:
Rentals | Apartment | Radius *10 total properties
29.54% average increase in impression share
Rentals | 1 Bedroom | Radius *4 total properties
85.12% average increase in impression share
Rentals | 2 Bedroom | Radius *7 total properties
68.66% average increase in impression share
Rentals | 3 Bedroom | Radius *1 property
325% average increase in impression share
Rentals | Studio | Radius *1 property
32% average increase in impression share
Conclusion:
7.56% average increase in occupancy rates over a 5 week period*
31.54% average increase in paid search users from July to August
27.71% increase in phone calls from July to August
563 Total Phone Calls in July (across 12 properties)
Avg 50 phone calls per day
719 Total Phone Calls in August (across 12 properties)
Avg 60 phone calls per day
For every 6.5% increase in impression share, occupancy rate increases 1%
To conclude, budget increases based on impression share are reliable in increasing both impression share, phone call conversions, and occupancy rates.
Holiday Metrics: Thanksgiving
Overview:
This case study looks at the impacts the holiday season has on apartment marketing, specifically related to paid search efforts. We examined trends for 12 different accounts over the 2018 & 2019 holiday seasons, looking at metrics including spend, site conversions (from Paid Search campaigns), calls, and website traffic. The main purpose of this study is to come to data driven conclusions on how best to focus our paid search strategies during the end of the year holiday season.
Thanksgiving Day vs. The Avg of 3 Thursdays Prior
-
Calls saw the biggest decrease of 76.65% when comparing Thanksgiving Day to the 3 Thursdays prior.
-
Google Ads Spend saw a slight decrease on Thanksgiving Day compared to the 3 Thursdays prior.
-
Even with only a small dip in spend, conversions and sessions from Paid Search campaigns dipped significantly.
Thanksgiving Week vs. 3 Weeks Prior
-
In the month of November, WoW performance fluctuated, with the week of Thanksgiving showing consistent drops across the board.
-
With Google Ads spend staying constant from Week 3 to Week 4, site conversions and website sessions from Paid Search campaigns still dropped.
-
Calls and All Website Traffic also dropped, staying consistent with Paid Search performance for Thanksgiving week.
-
The 2nd Week of November showed the strongest performance, even with lower Google Ads spend.
Thanksgiving Day vs. 5 Days Following
-
In the days following Thanksgiving Day, performance fluctuated similarly to Google Ads Spend. Typically when spend decreased, so did performance.
-
Website sessions increased day over day, showing traffic slowly recovering from the holiday dip.
-
Calls saw the biggest increase, seeing a 273.43% change on the day following Thanksgiving. Although they saw slight dips as spend decreased, overall they recovered quickly from the holiday hit.
Conclusion: Thanksgiving Strategy
Performance in November showed slight changes WoW, but overall performed well up until Thanksgiving day. Consider focusing most of your spend in the first three weeks of the month to optimize call volumes and site conversions, and keep Google Ads spend minimal in the final week of November, especially on Thanksgiving day. Expect calls to drop significantly on Thanksgiving day, and all other metrics to be down as well. In the days following Thanksgiving, all performance should return to normal, so spend can increase with positive results in these final days of the month.
Holiday Metrics: Christmas
Overview:
This case study looks at the impacts the holiday season has on apartment marketing, specifically related to paid search efforts. We examined trends for 12 different accounts over the 2018 & 2019 holiday seasons, looking at metrics including spend, site conversions (from Paid Search campaigns), calls, and website traffic. The main purpose of this study is to come to data driven conclusions on how best to focus our paid search strategies during the end of the year holiday season.
Christmas Day vs. The Avg of 3 Thursdays Prior
-
Calls dropped the most significantly on Christmas Day compared to the 3 weeks prior.
-
Although Google Ads Spend only dropped slightly on Christmas Day, Paid Search performance decreased much more significantly.
-
All Website Traffic decreased by ⅓ on Christmas Day versus the 3 weeks prior.
Christmas Week vs. 3 Weeks Prior
-
December performance fluctuated WoW, with no clear rockstar weeks.
-
Even with the highest spend of the month, Christmas Week performed the worst across the board. Calls were down most significantly, but site conversions and sessions also underperformed.
-
Website Sessions decreased throughout the month, regardless of Google Ads Spend.
Christmas Day vs. 5 Days Following
-
Search performance and website traffic following Christmas Day don’t show any correlation to Google Ads spend, with some decreases in spend resulting in high performance and vice versa.
-
With a large increase in Google Ads spend on the day after Christmas, all metrics sky rocket, but performance fluctuates in the following days.
-
Paid Search website traffic stays stable during this period, while metrics like conversions and calls show much more volatility.
Conclusion: Christmas Strategy
December performance trended down as the weeks passed, with Christmas week showing consistent drops. Consider pacing more aggressively towards the beginning of the month and pulling back leading up to Christmas. Christmas Day showed the most significant drop in performance, so expect all metrics to be down across the board on this day. In the days following Christmas, performance doesn’t show any clear trends, so it will be difficult to gauge your potential for success during this final week of the month.
Spanish Campaigns
Overview:
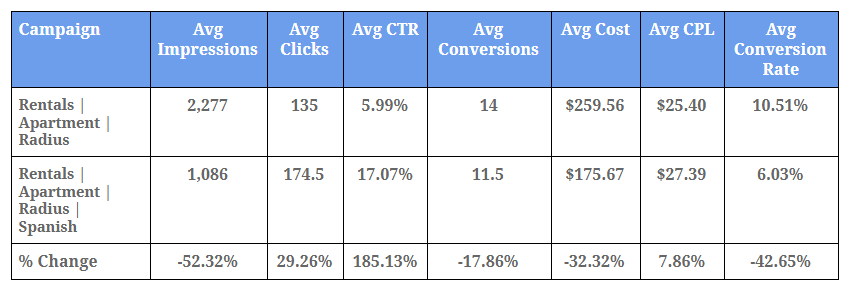
This test measures the performance of Spanish Campaigns that ran in the Miami & Orlando regions. The purpose of this test was to evaluate if including Spanish ad copy, keywords & targeting brings value to paid search campaigns, specifically for properties located in Spanish speaking areas.
Conclusion:
-
Standard NonBrand campaigns produced more impressions and conversions than Spanish NonBrand campaigns, while also spending significantly more than the Spanish campaign. Spanish NonBrand campaigns were able to generate more clicks on average than standard NonBrand campaigns, even when they had half the impressions.
-
Utilizing Spanish ad copy and keywords, CTR increased 185.13%
-
Utilizing Spanish ad copy and keywords, cost decreased 32.32%
-
Conclusion: Although Spanish NonBrand campaigns had a smaller reach than standard NonBrand campaigns, clicks, CTR’s and Conversion Rates were strong, which brought value to the portfolio.