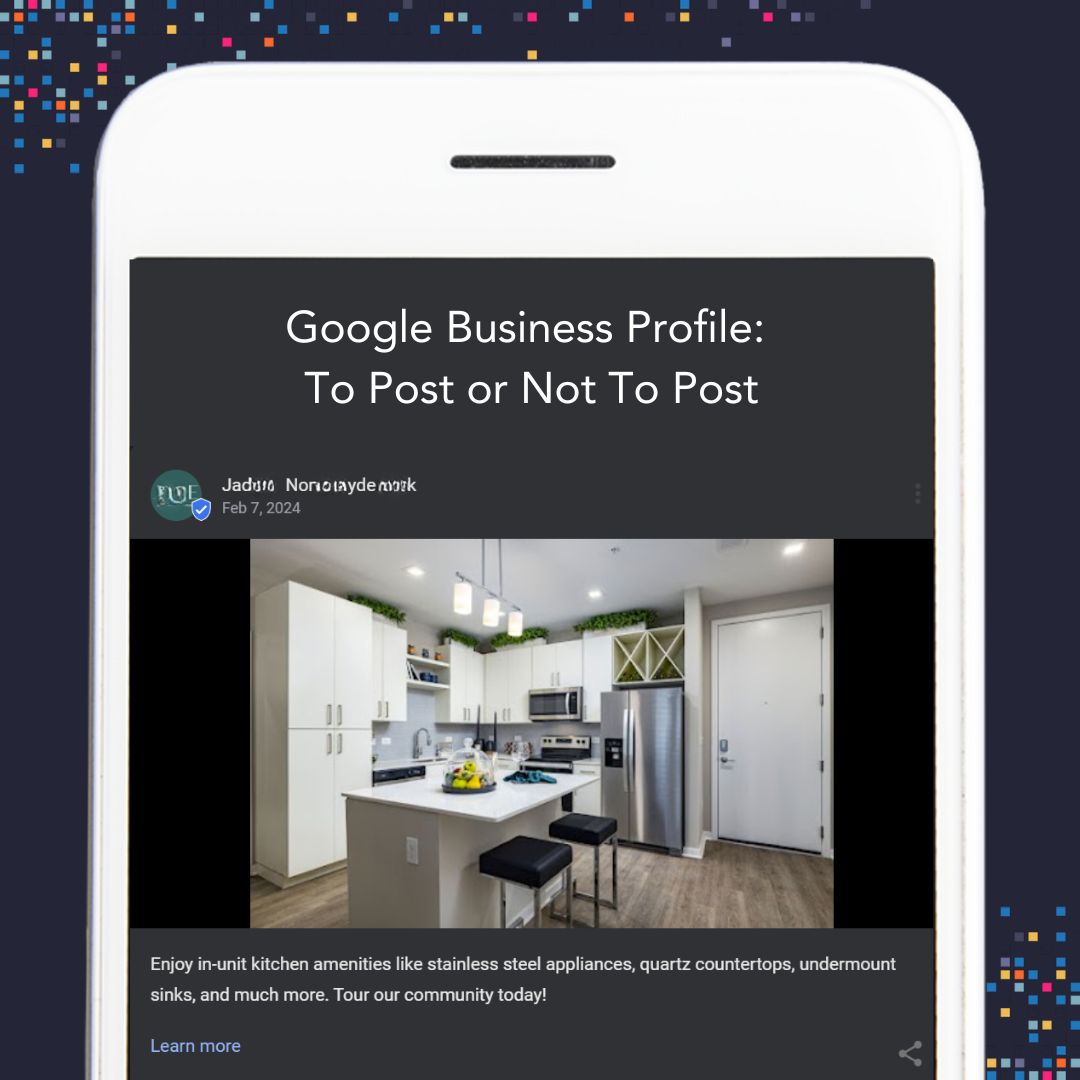


Renters increasingly rely on Google Business Profile (GBP) and interactive map experiences to assess location, commute, and neighborhood context before deciding to tour properties or submit lease applications. Recognizing this shift, Digible conducted a four-month study (May–September 2025) to measure how emphasizing Driving Directions within social media captions influences renter engagement and lead behavior. This case study evaluates whether adding ‘Get Directions’ links in social captions drives more high-intent actions.
As part of this study, we analyzed eight multifamily properties, all running Organic Social campaigns. Four test properties received our GBP Driving Directions optimization, while four control properties operated without. Notably, neither group ran SEO campaigns during the test period. This exclusion was intentional, as Search Engine Optimization’s (SEO) long-term organic benefits could have masked the specific impact of our study.
The results were striking: test properties outperformed control properties across every metric. Compared to control properties, test properties achieved 3.5x higher growth in Search Visibility (+247%), 3.5x higher growth in Direction Requests (+251%), and 50x higher growth in Calls (+4,948%). While large percentage increases can sometimes indicate low starting baselines, our results remain robust even when accounting for this factor. One test property did have a significantly lower baseline; however, when we excluded this property from our analysis, test properties still substantially outperformed control properties across all metrics.
This confirms that the observed performance gains reflect genuine intervention impact rather than baseline artifacts. The included results represent the full dataset, which confirms that taking a cross-channel approach drives stronger renter intent.
Facebook data further validated these findings. During the May–September period compared to January–April 2025, Engagements grew by +4%, Reach increased +17%, and Audiences soared +196%. While engagement rate declined slightly due to rapid audience expansion, overall visibility and activity improved meaningfully.
The results prove that adding GBP Driving Directions to social media captions drives consistent, high-intent engagement that holds steady through seasonal shifts. We’ve included clear steps, tracking tools, and a roadmap to help scale this strategy across your rental community’s portfolio.
Background
Search Behavior Shift
Prospective renters increasingly rely on GBP during their apartment search. Before scheduling a tour, they use Maps and similar platforms to assess commute times, explore nearby amenities, and evaluate overall neighborhood fit. What was once a discovery tool has become a decision-stage resource where renters confirm whether a community aligns with their lifestyle and daily needs.
This shift is even more apparent when social cues prompt renters to take location-based actions. A typical path looks like this:
- A renter sees a “Get Directions” CTA in a Facebook or Instagram post.
- It reminds them to check how close the property is to work, school, or essential amenities.
- Some tap the link directly, others open Google and search the property name.
- Both actions in Step 3 lead them to the GBP listing.
- There, they complete high-intent actions like requesting directions, visiting the website, or calling.
This simple, natural behavior loop explains why social CTAs often translate into measurable lifts in GBP metrics, even when the engagement doesn’t originate on Google.
Marketing Gap
Despite these proven behaviors, many multifamily marketers underutilize GBP and the “Driving Directions” feature, missing a key opportunity to capture high-intent prospects. Direction Requests signal a strong visitation intent, where renters are actively planning to visit your property. Yet most marketing strategies still prioritize website clicks and phone calls as primary success metrics, overlooking a key indicator of search-to-visit behavior that can predict tours and lease conversions.
Seasonality Considerations
We typically see apartment demand picking up in the summer and slowing down in the fall, but in this case study, we started to see something different. The boost from Driving Directions didn’t just fade when the busy season ended. Even as overall search volume dips, the lift in GBP engagement stayed stronger than expected. It’s an early sign that this strategy can help keep properties visible year-round, not just when leasing season is at its peak.
Multifamily Opportunity
Dialing in GBP Driving Directions, with accurate listings, strong CTAs, and clear tracking, gives multifamily marketers a high-impact way to lift results across organic search and social. Renters don’t just search; they navigate. Meeting them in those moments keeps your communities visible and competitive.
Objectives & Research Questions
Primary Objective
Measure how emphasizing or adding Google Business Profile (GBP) “Driving Directions” links within Organic Social media captions influences engagement signals, including Direction Requests, Website Clicks, and Calls, across both monthly and year-over-year timeframes.
Secondary Objectives
- Compare performance between test properties that include a link to get ‘Driving Directions’ in their social posts and a control group that does not, to isolate the impact of GBP optimization.
- Analyze cross-channel patterns by evaluating Facebook KPIs (Reach, Engagements, Engagement Rate) to confirm whether visibility and engagement lift extend beyond GBP.
- Translate findings into action by outlining clear recommendations on what to optimize, how to measure success, and what performance ranges to expect.
Key Research Questions
- Does emphasizing “Driving Directions” in Organic Social captions lead to higher Direction Requests and improved GBP metrics?
- Do increases in GBP interactions align with downstream engagement, such as website visits or calls?
- Are engagement lifts consistent across properties, or do results vary by location or current GBP interactions?
- Does ongoing optimization, by including Driving Directions in social posts, drive sustained YoY growth and help mitigate seasonality effects?
Scope & Cohorts
Test Properties
- Dream Aspen Creek
- Dream Boyd Theatre
- Prosper Orange Beach
- Dream Marine Creek
Each test property maintained consistent GBP tracking and Organic Social posting during the study period. One property, Prosper Pleasant Valley, was excluded due to rebranding and loss of GBP access.
Control Properties
- Dream Germantown
- Dream Space Coast
- Prosper Azalea City
- Prosper Gulfport
These properties served as the control group, providing a performance baseline for comparison.
Test and control properties were selected based on three criteria: active Organic Social campaigns, GBP access with historical data for YoY comparison, and no SEO efforts. While control properties had higher Google Search baselines, both groups showed similar pre-study performance for Google Maps metrics and overall interactions.
Timeframe
May, June, August, and September 2025: These four non-contiguous months were selected based on testing intervals and data availability. The study initially began as a two-month analysis in May and June, but early results indicated the need for a longer observation period to understand longer-term and seasonal impacts. Testing resumed in August and September to evaluate whether engagement patterns held over time, particularly as leasing activity naturally slowed later in the year.
Methodology
Design
This study followed an observational, multi-month comparison design, measuring performance across test and control properties over four months (May, June, August, and September 2025). Each test property received Facebook posts with links to Get Directions via a property’s GBP, while control properties received Organic Social posts without GBP links.
Data Sources
- Google Business Profile (GBP) Insights: Property-level data captured Searches, Views, Interactions, Driving Direction Requests, Website Clicks, and Calls. Year-over-year (YoY) and month-over-month (MoM) comparisons were used to identify sustained trends and independence from seasonality.
- Facebook Analytics (Supporting Data): Cross-channel indicators included Audience Size, Reach, Engagements, Follower Growth, and Engagement Rate, comparing May–September 2025 to the January–April 2025 baseline. This served as a secondary validation layer for measuring awareness and engagement lift beyond GBP.
Connecting Social Engagement to GBP Outcomes: User Behavior
This case study is grounded in how renters naturally move between platforms. To capture this full journey, we relied on GBP Insights and Facebook Analytics as our primary supporting data sources. Together, these platforms allow us to measure both the starting point (social reach and engagement) and the conversion moments that happen on Google, where renters take high-intent actions like searching, requesting directions, and calling.
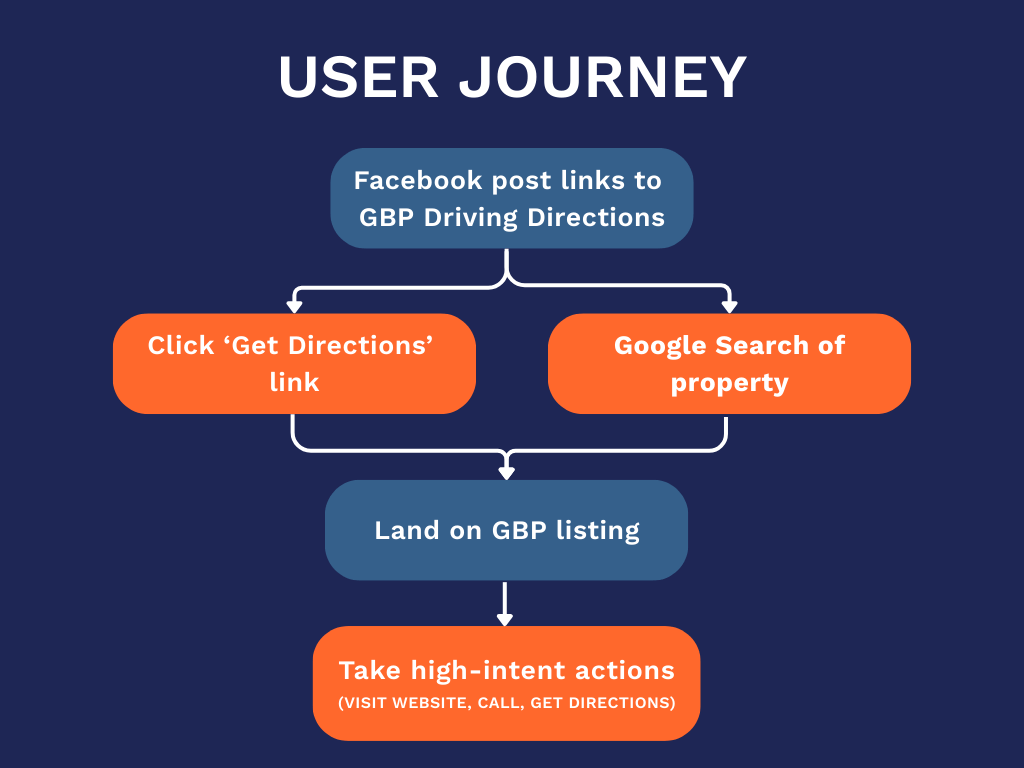
Social posts with a “Get Directions” call to action often serve as the starting point, prompting renters to think about location and proximity. From there, renters either click the link directly or search for the property by name, landing on the Google Business Profile.
Once on GBP, they take high-intent actions like requesting directions, calling, or visiting the website. Understanding this cross-channel journey helps explain why changes made on social media can drive measurable gains in GBP performance and downstream renter behavior.
Processing & Quality Assurance
- Results were grouped into Test vs. Control rollups to evaluate the magnitude and direction of growth across key metrics.
- Two analysts independently conducted data analysis using distinct calculation approaches and compared outcomes to ensure consistency. Both methods produced identical conclusions, validating the reliability of percentage change calculations.
- Verified alignment of date ranges, month labels, and metric definitions across all properties.
- Excluded Prosper Pleasant Valley due to rebranding and loss of GBP access during the study period.
- Ensured there were no changes to additional marketing strategies, like SEO, to influence GBP metrics.
- Applied normalization techniques to account for property size and baseline volume, then calculated relative percentage change to compare test vs. control performance.
- Let’s break this down using a real-world analogy! Imagine two people getting raises. Person A receives a 163.40% raise (goes from $50k to ~$132k). Person B gets a 46.58% raise (goes from $50k to ~$73k). If we simply consider the percent difference, we’d say Person A’s raise percentage was 116.82 points higher. While true, it doesn’t capture the full story. Instead, we could use the relative percent change to say, “Person A’s raise was 2.5x larger than Person B’s.”
This process ensured analytical rigor, peer validation, and a high-confidence dataset for the comparative results detailed in the next section.
Results
Based on the four-month analysis from May through September 2025, properties that emphasized “Driving Directions” in their Organic Social posts saw dramatically better results on their Google Business Profile than those that didn’t. The test properties averaged an 82% increase in GBP profile interactions compared to just 26% for the control group, more than triple the growth. The difference was even more pronounced for visibility metrics: GBP views increased by 307% for test properties versus 119% for control properties, and GBP searches skyrocketed by 579% compared to 167% for the control group. Put simply, test properties weren’t just growing faster; they were growing at rates two to three times higher across the board.
| YoY AveragesMay – Sept2025 – 2024 | Interactions | Views | Searches | Directions | Website Clicks | Calls |
|---|---|---|---|---|---|---|
| Test Properties | 81.93% | 306.98% | 579.13% | 163.40% | 60.28% | 130.25% |
| Control Properties | 26.03% | 119.23% | 166.68% | 46.58% | 32.53% | 2.58% |
| Percent Difference | 55.90% | 187.75% | 412.45% | 116.82% | 27.75% | 127.67% |
| Relative Percentage Change | 215% | 157% | 247% | 251% | 85% | 4948% |
*Relative Percent Change: The proportional increase of one percentage (test) relative to another (control). How much larger (in our case) our test properties’ GBP values are compared to the control properties’ GBP values.
The results were especially impressive for the GBP metrics that matter most to leasing teams. Test properties saw a 163% increase in Organic Social from Google Business Profile compared to only 47% for control properties, demonstrating that renters were more than twice as likely to seek out location information when it was emphasized upfront. Website clicks from GBP also showed strong results, with test properties outpacing control properties by 85%. But the most striking finding came from phone calls: test properties saw a 130% increase, while control properties barely moved at 3%. Our test properties generated nearly 50 times more call growth, proving that emphasizing directions doesn’t just improve awareness, it directly drives the actions that lead to leases.
Cross-Channel Supporting Metrics
To understand how gains in Google Business Profile (GBP) visibility extended beyond search, we analyzed Facebook Quicksight data from May through September 2025 and compared it to a January–April 2025 baseline. This analysis included Dream Aspen Creek, Dream Boyd Theatre, Prosper Orange Beach, and Dream Marine Creek.
These metrics help illustrate a common renter behavior pattern: discovery happens on social, intent builds in search, and engagement often circles back to social. Renters may first encounter a property through a Facebook post, search for it on Google to check location and proximity, and then re-engage with the brand on social before taking action. Viewing GBP and Facebook data together provides a more complete picture of how visibility and engagement reinforce one another across channels.
Test Property Engagement Breakdown
| Grouped Social Data – 4 Test Properties | Jan-April 2025 | May-Sept 2025 | Percent Change |
|---|---|---|---|
| Audience TOTAL | 374 | 1107 | 195.99% |
| Reach TOTAL | 25,205 | 29,548 | 17.23% |
| Engagements TOTAL | 815 | 851 | 4.42% |
Across these properties, Facebook reach grew by 17% and total engagements increased 4% over the baseline period. Most notably, audiences expanded by 196%, providing proof that the strategy didn’t just boost engagement, it brought new renters into the conversation.
Interpretation
These social gains mirrored the surge in GBP activity during the same period, especially in Direction Requests and Search Impressions. Renters who first discovered a property through Google Maps or local search often re-engaged with its Organic Social content, showing that visibility improvements reached far beyond a single platform.
Discussion
Impact of Driving Directions Optimization
Optimizing GBP doesn’t just increase search visibility, it changes how renters behave in the moments that matter. When Driving Directions are featured clearly and consistently, renters don’t simply scroll past these communities. They pause, look up the property, check how close it is to their daily destinations, and take more high-intent actions. We see more Organic Social, more calls, and more website visits which are all signals that renters are moving from casual interest to real consideration.
How Social CTAs Drive GBP Engagement
Adding a “Get Directions” CTA in social posts creates a behavior loop that pushes renters from social discovery into Google search. A renter sees the prompt, wonders how close the property is to work, school, or usual routes, and, rather than tapping the link, opens Google to search the property name. That search leads them to the GBP listing, where they complete high-intent actions like requesting directions, visiting the website, or calling. This simple social CTA sparks meaningful lift across channels, proving that awareness often begins on social media, but the real action happens in Google.

As we saw from this test, across all four test properties, visibility and engagement skyrocketed year over year when a CTA for “Get Directions” was included in the social caption. Searches, Views, and Direction Requests climbed by several hundred percent, showing that renters used these listings to move from interest to action. Each Direction Request represented a renter who was one step closer to touring in person, and that’s a measurable leap in leasing intent.
Cross-Channel Lift Across Search and Social
Including these links in social captions created measurable ripple effects across social media performance. As Driving Directions activity grew, Facebook reach and engagement rose in step, proving that when renters discovered a property in Google Maps, they were more likely to see and engage with it on social media, too. The same audience that searched also scrolled, clicked, and shared. By connecting SEO and social strategies, Digible helped these properties show up where renters were already looking and where they were spending time.
Sustained Engagement Beyond Peak Season
Apartment marketing follows predictable seasonal patterns, with leasing activity typically peaking in summer and declining through fall. Our month-over-month data showed these typical seasonal patterns. But zoom out to the year-over-year view, and a different picture emerges: GBP metrics remained substantially elevated compared to the previous year, even during September. This lends to the fact that our cross-channel strategy can elevate baseline performance across all seasons, not just during leasing peaks. Looking for seasonal and budget insights? Check out our PMax Case Study for the full breakdown.
Implications for Multifamily Marketers
This study demonstrates that coordinating Facebook organic content with GBP Driving Directions delivers measurable impact. Renters who discover multifamily communities online convert that interest into real-world visits, using directions and placing calls at significantly higher rates. Adding this strategic link to your Facebook posts turns followers into prospects who navigate directly to your properties.
What Does This Mean For Your Property?
When renters are apartment hunting on Google, location and convenience are top priorities. By making it easy to see how to get to your property and emphasizing directions in your online presence, you’re answering a key question renters have before they even ask it. The data shows this approach works across the board. Every test property saw substantial improvements in its GBP performance, with some individual locations experiencing search increases of over 900% during our testing period. This strategy delivers consistent, measurable results that directly support your leasing goals by getting more qualified prospects to notice, engage with, and ultimately contact your community through Google.
Here’s How To Apply This Across Your Own Communities With Digible
At Digible, we help communities connect SEO and Organic Social to reach renters across every stage of their journey. If you’re ready to appear more often in local search, grow your visibility across channels, and convert digital intent into real tours, we’re ready to help.
Let’s make your properties easier to find, and impossible to forget.
Co-authored by Franny Suarez and Kristen Powers.