




Insights from a Resident Focus Group
Executive Summary
For years the multifamily industry has treated organic social media as a brand awareness channel, a place to look good rather than a place that actually moves someone toward signing a lease. Success was measured in likes, follows, and whether the feed looked polished.
We wanted to test that assumption directly. Instead of relying on what people say they pay attention to, we paired a live resident focus group with eye-tracking technology and watched what they actually looked at, down to the millisecond.
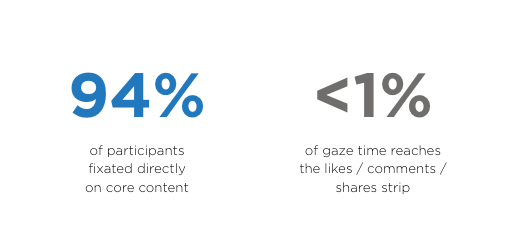
Here’s what we found. Attention and conversion are not the same thing. Across every format we tested, the core visual grabbed attention almost universally: on average, 94% of participants fixated directly on it, usually within half a second. But that instant, near universal attention didn’t do much on its own to move people closer to actually leasing. Content wins the eye in milliseconds. It doesn’t win the decision by itself.
We saw that gap play out again and again throughout this study: getting noticed and getting someone to lease are not the same thing.
The Challenge
Every multifamily marketer eventually asks some version of the same question: does organic social actually influence whether someone leases, or is it just a brand awareness checkbox we keep because everyone else does it? At Digible, we manage this content daily for hundreds of communities, but like most of the industry, we’ve largely trusted platform reported engagement (likes, comments, shares, follows) as our proxy for whether content is working.
The problem is that those metrics only tell us what a small, self selecting slice of an audience chose to do after they’d already decided to engage. They don’t tell us what happened in the seconds before that decision, for the much larger group of people who saw the post and scrolled on without tapping anything.
This study set out to close that gap. Rather than layering on another survey about stated preferences, we brought biometric measurement into the process: gaze tracking, fixation counts, time to first fixation. That let us observe what residents actually looked at, in what order, and for how long, before they ever had the chance to tell us what they thought. Most multifamily marketers rely on likes and comments as their only signal of content performance. This study let us validate, or challenge, our own working assumptions using primary data instead.
Methodology
To better understand how today’s renters engage with apartment marketing, Digible conducted an in-person focus group with eight current apartment residents between the ages of 21 and 54. Rather than relying on surveys alone, the study combined eye-tracking technology, live apartment search simulations, and moderated discussions to capture both what participants noticed and why those moments influenced their leasing decisions. This mixed-method approach provided a more complete view of the renter journey, from discovering a property on social media to evaluating it during an active apartment search.
Throughout the study, Digible collected both quantitative and qualitative data. Metrics such as Visual Attention Index (VAI), fixation count, time-to-first-fixation (TTFF), gaze duration, and survey responses were paired with participant feedback to provide context behind observed behaviors and preferences.
Research Design
The research was designed to mirror a real renter journey through four sequential activities. Participants first took part in a warm-up discussion about their social media habits, apartment search behaviors, and the factors that influence trust. They then completed a live apartment search simulation across both desktop and mobile devices while screen recordings captured their search process.
Next, participants evaluated a range of apartment marketing content using RealEye eye-tracking technology, allowing researchers to measure visual attention through heatmaps and fixation data. Tested content included static social posts, carousel posts, Reels, and AI-generated imagery. Carousel content was presented as video simulations to measure frame-by-frame attention, providing directional insights while acknowledging that the experience differs from native swipe behavior. The session concluded with a moderated discussion and survey to better understand the motivations behind participants’ decisions and identify themes that quantitative data alone could not explain.
Participant Snapshot
The focus group represented a diverse mix of renter profiles, with an average participant age of approximately 37. The group included five women, two men, and one participant who chose not to specify a gender. While intentionally small and designed to provide directional insights, the participants reflected the digitally engaged audience multifamily marketers are trying to reach.
One insight emerged before the content testing even began: only one of the eight participants followed their apartment community on social media. The remaining residents primarily relied on email and text messaging for community updates, revealing an early disconnect between where apartment communities invest in content and where residents actually expect to receive information. As the research progressed, this gap continued to surface across multiple stages of the renter journey.
The Renter Journey Isn’t Linear
Our focus group revealed that the renter journey is not linear, but a process of discovery, comparison, and validation across multiple platforms. It often begins with structured search on Google, ILS websites, and Maps, where renters narrow their options, then shifts to comparing floor plans, amenities, and pricing. As they get closer to making a decision, validation becomes the priority. While entertainment and inspiration happen on platforms like Instagram and TikTok, confidence is built through Reddit, online reviews, and authentic resident experiences. We also found that device behavior reflects this shift. Desktop is used for research and side-by-side comparisons, while mobile is used for quick visual checks and confirming impressions on the go.
Ultimately, leasing decisions come down to trust. Safety, cleanliness, and the ability to picture yourself living in a community have a greater impact on conversion than engagement alone. For multifamily marketers, the takeaway is clear: awareness gets renters into the funnel, but trust is what moves them to sign a lease.
What the Eye-Tracking Data Actually Shows
Where does attention actually go on a piece of social content? We measured this using RealEye’s area of interest tracking across all 15 pieces of content tested, breaking each post or video into its parts: the core visual, the caption, the visible comments, the username and profile header, and the likes/comments/shares strip.
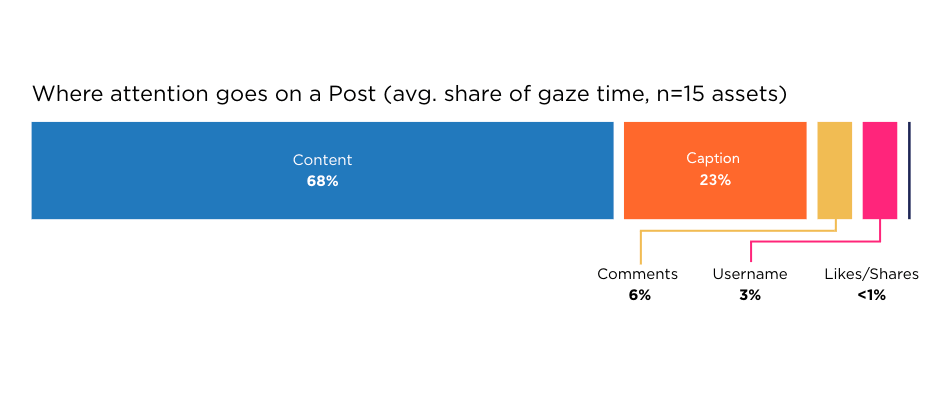
The pattern held across every format. Averaged across all 15 assets by total gaze time, roughly 68% landed on the core visual, 23% on the caption, 6% on visible comments, 3% on the username and profile area, and less than 1% on the likes/comments/shares strip.
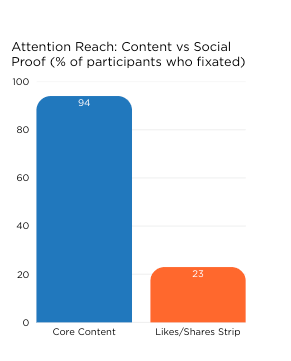
Put another way, the visual is doing nearly all the work. On average, 94% of participants fixated directly on the core content of each asset, while the engagement proof elements (the likes, comments, and share counts a lot of us assume shape perception) reached only about 23% of participants and consistently scored under 20 on our Visual Attention Index, often landing at 0. Residents are, for practical purposes, blind to social proof unless it’s built directly into the visual itself.
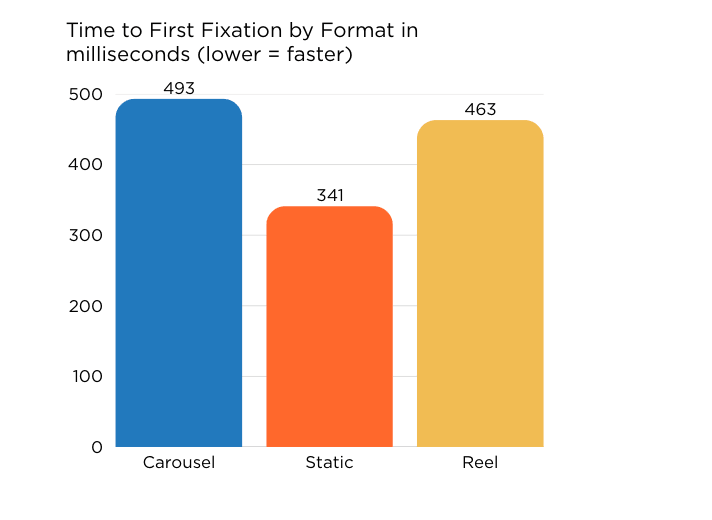
Attention also arrived at different speeds depending on format. Static images hooked the eye fastest, averaging 341 milliseconds to first fixation. Reels took a bit longer to orient, at roughly 463 milliseconds, and carousels were slowest, at about 493 milliseconds.
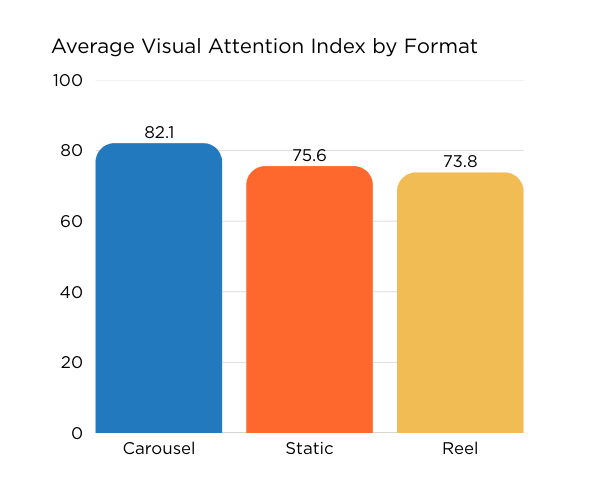
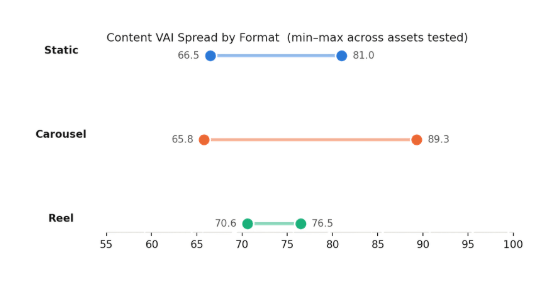
Once attention did land, though, carousels held it best, averaging a Visual Attention Index of 82.1 on the primary visual, compared to 75.6 for static posts and 73.8 for Reels. That’s a meaningful nuance.
Carousels win on depth of attention once someone is looking, but as the format breakdown in Section 7 covers, they’re also the format most at risk of losing someone before they get there, since this test measured frame level attention rather than true swipe behavior.
Format-by-Format Breakdown
We showed residents four formats of social content during the RealEye survey portion: static posts, carousels, Reels, and AI-generated content. After each one, residents answered a short question built around what they’d just seen, whether they’d keep watching or skip it, what they’d actually remember, whether it made them more or less interested in the community, whether they could pick out which image was AI-generated, and whether, honestly, it would make them consider living there. Below is how participants reacted to those questions, format by format, and what we found once we compared their answers against the AOI eye-tracking results. Areas of Interest (AOIs) are specific elements within each piece of content that we selected to measure where participants looked, how quickly they noticed them, and how much attention they received.
The two data sources are answering different questions, and it’s worth keeping them separate. The AOI metrics show where people actually looked and for how long, regardless of what they said out loud.
Within each AOI, we measured VAI (Visual Attention Index), which shows how effectively that area captured attention; fixation count, which shows how many times participants focused on it; and time-to-first-fixation (TTFF), which shows how long it took participants to look at it for the first time. The survey responses add context by letting residents explain their reactions in their own words immediately after viewing the content, rather than leaving us to interpret gaze data alone. Together, the two sources give us a more complete picture: eye-tracking shows us what earned attention, while the survey responses help us understand what that attention meant to the person giving it.
One thing came up on almost every piece residents were shown, in both the survey answers and the broader group discussion: whether it felt real or felt staged. In a few of these breakdowns, that ends up mattering as much as the format itself.
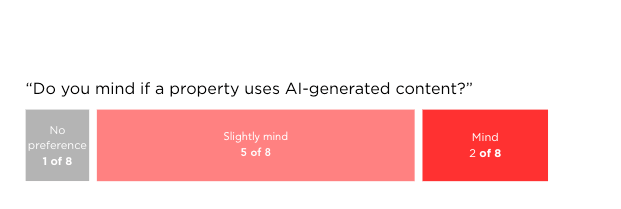
On the direct question of whether residents mind a property using AI-generated content, only 1 of 8 had no preference. Five said they’d slightly mind, and two said they’d mind outright, so there’s real hesitation here, even though nobody’s attention actually dropped when they were looking at AI-generated pieces. What came up in discussion helps explain why: undisclosed AI or influencer content was named specifically as something that turns people off right away, right alongside hidden fees. So the issue isn’t AI itself so much as AI, or influencer content, presented as if it weren’t. Used quietly and disclosed honestly, it can still hold a supporting role. Presented as something it’s not, it costs trust fast.
Static Posts
“The unit looks nice in the social media post, but I’d want to know more about the price and location.”
| Eye Tracking Data | Survey | Group Discussion |
| Static images grab attention quickly and reliably. Content VAI reached as high as 81.0 on the strongest asset, averaging 75.6 across the five static images tested. A higher VAI indicates that an element captured a greater share of participants’ visual attention, so these scores tell us the static creative consistently drew people in. Caption attention was also meaningfully high, ranging from 58 to 73 VAI. This makes static the one format where participants consistently paid attention to the caption rather than skipping past it. | On their own, static posts don’t do much to move someone toward a decision. Residents wanted to see a property’s real amenities, not staged versions of them. | Properties often don’t show what actually makes them different. One property, for example, has an on-site trail that residents didn’t know existed because the property’s content had never highlighted it. It’s exactly the kind of amenity that could set a community apart, but only if residents and prospects know it’s there. |
Carousels
“I would swipe if the first image caught my attention… probably not all the way through unless it stayed interesting.”
| Eye Tracking Data | Survey | Group Discussion |
| Carousels had the highest average content VAI of any format we tested, 82.1. Once someone looks, they hold their gaze longer than static or Reels do. *Data Call-Out: 82.1 VAI is a ceiling, not a guarantee. Carousels were shown to participants as video simulations instead of true swipeable posts, so this measures frame-level attention, not real swipe behavior. | Residents responded better to carousels that looked like something a resident posted rather than something a marketing team staged. | Comparing user-generated content against professionally shot photos came up specifically, in the discussion, as something that helped people picture themselves actually living somewhere, in a way polished photography didn’t. |
Reels
“Views look amazing, I might learn more about price and amenities.”
| Eye Tracking Data | Survey | Group Discussion |
| Reels had the fastest emotional read and the highest engagement ceiling of any format. Reel content VAI ranged from 70.6 to 76.5 across the five Reels tested, a spread of just 5.9 points, the tightest of any format. That narrow range is significant because it shows Reels captured strong visual attention consistently, regardless of the individual creative. In other words, attention wasn’t driven by one standout Reel. The format itself reliably got participants to look. | Residents who follow a property’s account on Instagram said they go straight to the Reels tab rather than scrolling the main feed, which says a lot about where attention already lives on that platform. | Video also came up in discussion as the format residents wanted more of, specifically behind-the-scenes footage showing what actually living somewhere looks like. Several said a resident-shot video told them more than a produced virtual tour would. |
AI-Generated Static Posts
“I don’t have a preference.”
“I slightly mind.”
“It doesn’t bother me as long as it looks real.”
| Eye Tracking Data | Survey | Group Discussion |
| Attention held up fine. Nobody’s gaze behavior changed because a piece of content was AI-generated. | On the direct survey question of whether residents mind a property using AI-generated content, 1 of 8 had no preference, 5 of 8 said they’d slightly mind, and 2 of 8 said they’d mind outright. | Undisclosed AI or influencer content was named specifically as something that turns people off right away, right alongside hidden fees. The issue isn’t AI itself so much as AI, or influencer content, presented as if it weren’t. |
The Attention ≠ Conversion Gap
Every metric in this study points to the same uncomfortable truth for content creators: attention is not the bottleneck. Across formats, the core visual reached 94% of participants and pulled sustained gaze (VAI in the 74 to 82 range) within roughly half a second. If the goal were simply to get people to look, every piece of content tested would qualify as a success.
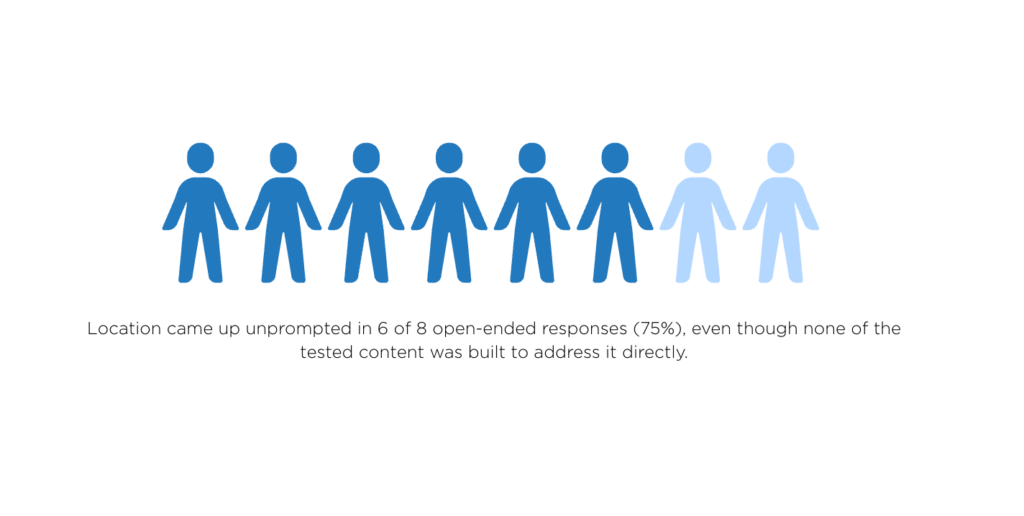
But looking isn’t leasing. When we paired the eye-tracking data with what participants actually said afterward, the same gaps kept showing up no matter the format: people wanted to know the price, they wanted a real sense of the location and what’s nearby, they wanted to see the unit itself instead of just the amenity spaces, and they wanted some signal that what they were looking at was real. Location came up unprompted in 75% of open ended responses, 6 of 8 participants, even though none of the content tested was built to answer that question directly.
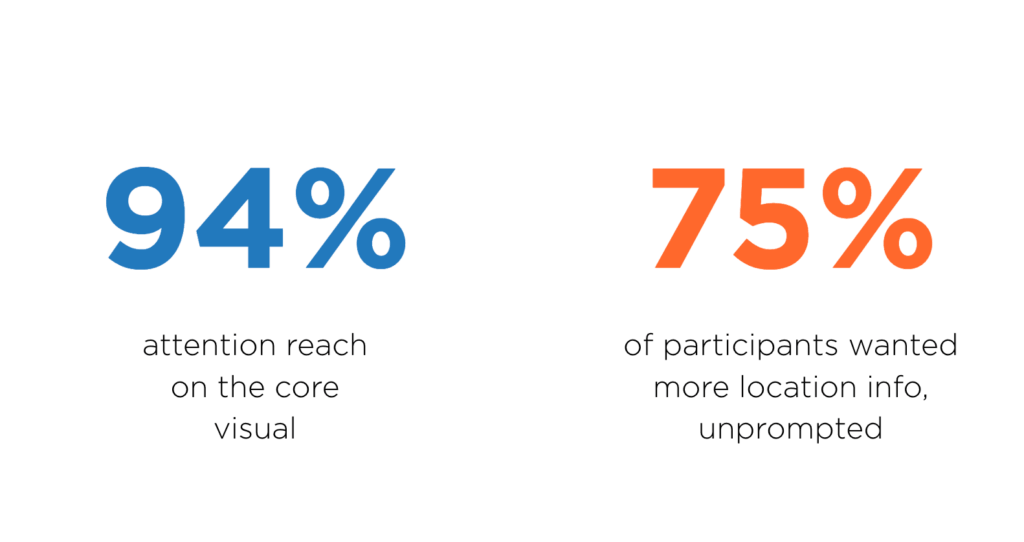
That’s the gap this study surfaces most clearly. We went in assuming that better content, sharper photography, more polished video, and higher production value, would translate into more leasing interest. What we actually found is that better content earns more attention, but only informative content converts it. A beautifully shot Reel and a beautifully shot static post can post nearly identical VAI scores. The difference in whether one moves someone toward a lease comes down to whether it answers the three or four questions (i.e What would it actually be like to live here? Does it have what I care about? Is it worth the price? And what makes it worth choosing over another property?) every renter is quietly asking as they scroll.
Trust as the Hidden Variable
Trust emerged as the deciding factor throughout the renter journey. While price, location, and amenities help renters narrow their options, the final leasing decision is often driven by emotional cues. Participants consistently pointed to safety, cleanliness, an active community, responsive staff, and authentic resident experiences as the signals that gave them confidence to move forward. They wanted to see how people actually lived in a community, not just what it looked like. This presents an opportunity for multifamily marketers to rethink the role of organic social media. Rather than serving only as an awareness channel, social media can become a powerful tool for building trust through resident stories, neighborhood highlights, community events, and everyday moments. By showcasing authentic experiences instead of polished marketing, communities create the social proof prospective renters need to confidently picture themselves living there.
Recommendations Framework
Based on the focus group insights, we developed four recommendations to help multifamily brands create more authentic, community-driven marketing.
Build a Sustainable UGC Engine
Create a repeatable process for capturing authentic resident content instead of relying on one-off campaigns. Identify key moments throughout the resident journey, make participation simple, establish clear content guidelines, and create a system for collecting, organizing, and reusing content across channels. A scalable approach ensures a steady stream of authentic stories that can support marketing efforts over time.
Launch Hyperlocal Content That Builds Trust
Highlight the people, places, and experiences that make a community unique. Featuring residents, local businesses, neighborhood recommendations, and everyday moments helps prospective renters picture themselves living there. Recurring content series and short, story-driven formats create consistency while reinforcing authenticity over highly produced marketing content.
Incentivize Participation
Make content creation a natural part of the resident experience by increasing awareness of participation opportunities and lowering the barrier to contribute. Small incentives, recognition, and resident spotlights can encourage ongoing engagement, while existing loyalty or rewards programs can provide an easy framework for participation at scale.
Publish Community-First Stories
Shift from showcasing properties to showcasing life within the community. Instead of focusing solely on amenities, highlight how residents use and experience those spaces through authentic, everyday moments. Extend this content beyond social media into websites, email campaigns, and other resident touchpoints to reinforce social proof and create a more cohesive brand experience.
What This Means Beyond One Property
Zoom out from this one property, and the findings validate some of what Digible has operated on for years, and sharpen the rest.
We’ve long recommended video-first content for multifamily social. This study didn’t just confirm that instinct, it told us why, and the why matters more than the recommendation itself. Video, in the form of Reels, wins the emotional read and holds the highest engagement ceiling, but it’s also the format most vulnerable to an instant skip if the opening seconds don’t land. That’s a more actionable rule than “post more video.” It’s closer to “post video, but front load whatever makes someone stop.”
We’ve also treated organic social primarily as a top of funnel, awareness building channel, a place to look good rather than a place that does the heavy lifting of moving someone toward a lease. That assumption held up more than we expected. The content tested was excellent at capturing attention, and the near total blindness to likes, comments, and shares confirms that engagement counts aren’t actually shaping how residents perceive a property while they’re looking at it. What got refined is the idea that awareness and conversion sit in separate stages of the journey. They don’t. The same post that builds awareness is also the resident’s first real chance to answer their price, location, and “is this real” questions, and most content, across every format tested, doesn’t take that chance.
The Key Takeaway
The takeaway for the industry isn’t simply “post better content.” Every piece of content in this study already looked good and earned real attention. The opportunity is to recognize that earning attention and helping renters evaluate a property are two different jobs, and organic social can do both.
That doesn’t mean turning every post into a leasing brochure. It means using social’s flexibility more intentionally: some content can build affinity and show daily life, while other content answers common questions, addresses objections, or surfaces the details that make a property worth considering. The website can take over when renters need deeper information or are ready to act, but social will have already played a meaningful role in getting them there.
Renters are increasingly using Instagram and TikTok as search engines, and to decide whether a property is truly worth considering. And this goes further than our commonly held view that a “keeping the lights on” social strategy is enough anymore. Someone might discover a property on Instagram, see an amenity that catches their attention, and Google the property a week later. The website gets credit for the conversion, but social was still part of the journey.
Instead of treating social as just a marketing channel, we must start treating it like a product channel that helps renters discover, understand, and evaluate a property.
Methodology Appendix / Data Transparency
- Full breakdown of AOI metrics used (VAI, fixation count, TTFF, gaze time) and metrics intentionally excluded (K-coefficient, click data, revisit counts, too granular/not meaningful for this audience per the original data notes)
- Sample size and demographic disclosure (n=8, ages 21–54), important to state plainly given the directional (not statistically representative) nature of the findings