$100K Lease-Stakes


Overview
In December of 2019, CoStar, the parent company to the Apartments.com brand, committed to the largest marketing investment in multifamily history: a $100 million increase in annual paid search and media spend for Apartments.com. With this unprecedented move in mind, we designed an ongoing case study to measure impression share for brand and non-brand campaigns.
Our goal with this research is to track the industry-wide repercussions of CoStar’s investment and to gain a better understanding of how the additional media spend of Apartments.com is affecting our own paid search campaigns.
Challenge
The massive increase in spend from one of the biggest advertisers in the industry will almost certainly require marketers to shift strategy and focus for their 2020 digital marketing campaigns. After all, paid search in the multifamily industry has already seen increasing CPCs year-over-year; this is bound to accelerate even more as Apartments.com continues to garner unparalleled levels of exposure.
Now, perhaps more than ever before, advertisers will need to closely monitor their competitive metrics to make sure that their advertising dollars are being spent in the most effective and efficient way possible.
Strategy
To help apartment marketers measure the impact of the Apartments.com investment, we will run a continuous case study to track Impression Share for brand and non-brand search terms, as well as the Top of Page Rate.
Brand Impression Share = the percentage of impressions that your ads receive compared to the total number of impressions that your ads could receive for brand terms.
Non-Brand Impression Share = the percentage of impressions that your ads receive compared to the total number of impressions that your ads could receive for non-brand terms.
Top of Page Rate = how often your ad (or the ad of another participant, depending on which row you’re viewing) was shown at the top of the page, above the unpaid search results.
Results
With the first two months of 2020 in the books, we are already seeing some impact.
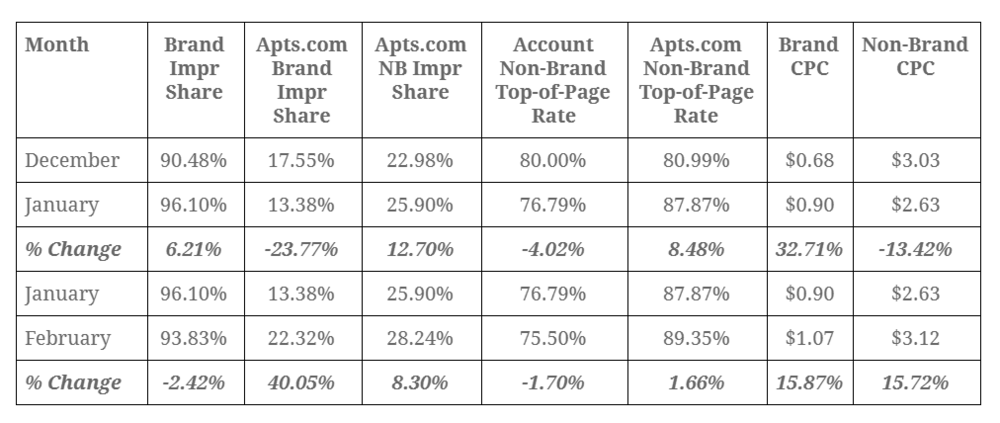
Key Findings
-
Apartments.com has increased their Non-Brand Impression share by 21.7% YTD
-
Apartments.com has increased their Top of Page Rate by 10% YTD
-
CPCs have increased for both Brand (57% increase) and Non-Brand. Even measuring from December onward (a relatively short time period to track), we have started to see a sharp increase by the end of February.
Conclusions
So, what’s the next step, you ask? Great question. We will be updating our blogs and case studies monthly to keep you up to date on the impacts MoM and YTD. Plus, we will use the data to drive our performance recommendations, offering ideas and tips about how you can optimize your campaigns to stay ahead of the game.
Stay tuned.