
Brought to you by the Digible Paid Media team
Curious about what we’ve been up to lately? Here are the results of some of our most recent tests, as well as our conclusions based on all of our learnings. Enjoy!
Display
Creative Testing: Seasonality
This test focused on the efficiency of pool images versus interior images through the winter months. Let’s dive into the results:
-
While the pool image display ads saw almost half of the number of impressions as the standard ads, the pool imageads always saw a significantly higher viewability, which could indicate that the placement was (on average) closer to the top of the page.
-
This premium level of viewability affects the bid for the top of page placements, thus increasing the cost paid for the display ad to be placed.
Conclusion: For property managers with leaner budgets, sticking to the standard image ads during winter months will encourage high impressions and decent user engagement. However, if your budget is generous, consider running pool image ads during these winter months to drive increased user engagement and keep site visits high.
Desktop v. Mobile
For this test, we took a look at display performance, specifically noting the differences between desktop and mobile. Here are our findings:
-
The DV360 algorithm allocates almost 300% more spend to mobile vs. desktop
-
Mobile saw 166% more Site Visits than desktop
-
Mobile had a 32% lower Site Visit Rate than desktop
-
Users are 433% more willing to click on a display if viewed on their mobile device
-
Users are 77% less likely to visit a site after viewing an ad on mobile vs. desktop
-
Mobile has a 200% higher viewability rate than desktop meaning ads are 2x more viewable on mobile than on desktop.
Conclusion: Continue optimizing towards mobile and desktop.
Search
Call-Only Ads & Call Quality
Last December, we started testing call-only ads and found that:
-
Expanded text ads spent a significant amount more than call-only ads.
-
However, call-only ads had a much more efficient conversion rate.
In part two of this test, we utilized DialogTech to understand call quality from call-only ads and found that:
-
Call-Only ads, on average, have a 37% higher lead quality score than Google Call Extensions
-
Call-Only ads, on average, have a 24% lower lead quality score than onsite calls
Conclusion: Call-Only ads are right in the middle of GCEs and dynamic number insertion in terms of lead quality. In other words, call-only ads are a beneficial addition to accounts! These ads are not in our account creation template, but a great addition for any account struggling with call volume or call quality.
Search Lead Form Extensions
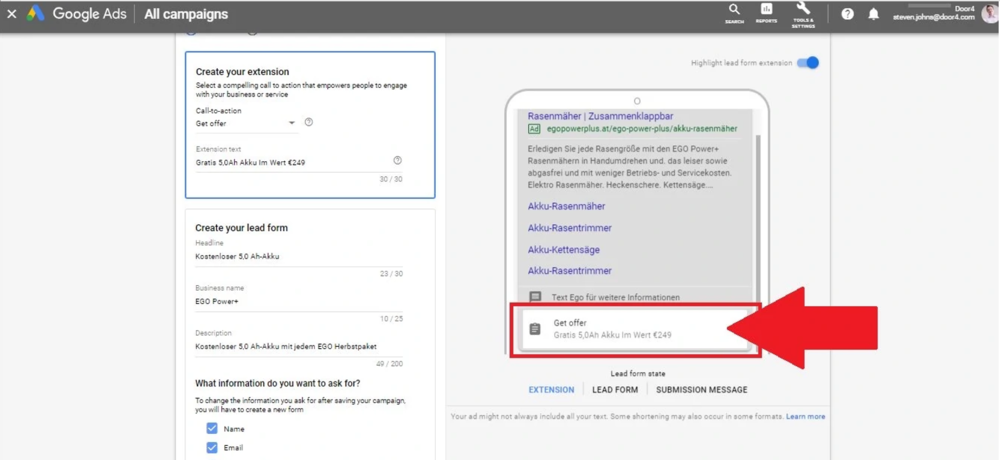
As a Google Premier Partner, Digible was granted access to test the Google Lead Form Extensions beta. Lead form extensions appear at the bottom of a search ad. When clicked, they expand into a form with fields that allow a user to send their name and email address to a property, all before they’ve even visited the site.
-
Since launching in Fall 2019, Lead Extensions have had extremely low user engagement on the extension button and lead form, with only a handful of clicks. Of these clicks, however, the likelihood of filling out the form and converting is strong.
-
0.09% Avg CTR
-
40.00% Conv Rate
-
-
Despite the near-zero click throughs on the lead form itself, when the extension is present (typically in conjunction with several other extensions), we see high engagement through the ad — users are clicking on the ad’s headline to get to the landing page.
-
When the lead extension is present, we have 12.13% Avg CTR and 12.66% Conv Rate
Conclusion: While lead volume though the extension is low, these extensions are an opportunity to take more real estate on the Search Engine Results Page. Plus, they cause ads to look unique, which increases ad engagement. However, there is not enough data to indicate whether the leads in the lead forms are high quality.
Apartments.com Spend Increase
In December of 2019, CoStar, parent company to the Apartments.com brand, committed to the largest marketing investment in multifamily history: a $100 million increase in annual paid search and media spend for Apartments.com. With this unprecedented move in mind, we designed an ongoing case study to measure impression share for brand and non-brand campaigns. Here’s what we learned:
-
From January to February
-
Apartments.com brand impression share increased an avg 40%
-
Apartments.com non-brand impression share increased an avg 8%
-
Avg Brand CPC increased by 16%
-
Avg Non-Brand CPC increased by 16%
-
-
From February to March
-
Apartments.com brand impression share increased an avg of 8%
-
Apartments.com non-brand impression share decreased an avg of 11%
-
Avg Brand CPC decreased by 12%
-
Avg Non-Brand CPC increased by 17%
-
-
From March to April
-
Apartments.com brand impression share decreased and avg of 63%
-
Apartments.com non-brand impression share decreased an avg of 11%
-
Avg brand CPC decreased by 0.62%
-
Avg non-brand CPC decreased by 19%
-
Conclusion: In February, it was clear that we had more competition in the market. However, COVID-19 appeared to throw a wrench in the Apartments.com strategy. As we approach the end of Q2, it will be interesting to see how aggressive, or not aggressive, Apartments.com chooses to act in the search space.
Negative Audience of Resident Clicks
Here, we tested implementing residents as a negative audience. Unfortunately, the results are not terribly helpful at this point. But here they are, for what it’s worth:
-
Currently, audiences are too small to use in PPC.
Conclusion: Since the results are sort of anticlimactic, it might be worth retesting with larger social budget campaigns that drive to websites (as opposed to canvas ads).
Social
Search vs Social Call Quality
This test measured the difference in call quality between calls driven by Facebook versus Search. Here are the results:
-
Calls driven by social traffic had the same average lead score as keyword calls.
-
Calls driven by social traffic had 110% higher lead score than Google Call Extensions.
Conclusion: Traffic driven by social ads are more likely to be quality leads than those calling from GCEs. Considering implementing more ad types that promote clicks-to-website on Facebook.
Targeting: Friends of Follower
With strict targeting regulations on Facebook (recently put in place to ensure compliance with the Fair Housing Act), getting creative with audiences can be difficult. However, we did test one available audience, friends of followers, and found that:
-
Friends of followers audience increased CTR by 16%
-
Friends of followers audience decreased average Canvas View Time by 11%, but increased Site Visits by 289%
-
While maintaining a high Site Visit Rate, friends of followers audience decreased the average Cost/Site Visit by 4%
-
Targeting friends of followers is less expensive than standard targeting with a 6% lower CPM
Conclusion: In order to increase quality site traffic, friends of followers is a trustworthy audience to add to social campaigns. Just be aware that your canvas ad average view time might decrease. It only means that this particular audience needs less time to visit the website due to the fact that they are more qualified than general targeting.
Native
Nativo
In Q1, we tested native advertising using Nativo. Native advertising utilizes paid advertisements that look and feel like they are a part of the site on which they are served. In other words, they appear to be native to the site. After testing for three months, here are some of our results:
-
.63% CTR
-
9.67% CTA Rate (call-to-action clicks to site)
-
37.26 seconds Avg. Time on Content
-
54.01% Engagement Rate 15s+
Conclusion: Native advertising serves as an effective tactic for properties struggling with brand awareness and engagement. Apartments and Native advertising proved a successful combination as our campaigns exceeded the CTA Rate benchmark by 383%. Additionally, Nativo utilizes premium inventory to ensure your Native ads and articles are served on quality websites that are highly trafficked and geared towards your target audience.
YouTube
Bumper Ads
In this test, we measured the performance of bumper ads. Here are the results:
-
36,891 Impressions
-
52 clicks
-
$200 spend
-
$5.42 avg CPM
-
93.26% of viewers played ad to 100%
-
3 assisted conversions
Conclusion: Bumper ads are best used to create brand awareness and reach. Both are fairly hard metrics to measure; however, with 3 assisted conversions at a $66 CPL, we can assume our small spend made a difference. In the future, this is a worthwhile test to roll out for properties struggling with brand awareness or market saturation.
Waze
Branded Pins & Promoted Search
For one month, we tested Waze ads. We used one account and a $200 spend budget. Here are the results:
-
Pin
-
87,071 Impressions
-
32 Ad Unit Clicks
-
0 Navigations
-
Search
-
247 Impressions
-
1 Ad Unit Clicks
-
0 Navigations
Conclusion: Overall, these are very low interaction metrics. Waze typically sees more success with businesses willing to spend larger amounts, as well as businesses with 10+ locations.